I have collated over 40 years-worth of Cancer registration Data England & Wales.
That data is uncorrupted by current spin to redefine who died of what.
What is clear is a significant rise in Cancer registrations 1971-2017, and from, 2007 as a surge which correlates to the ownership of Mobile Phones.
However EMF irradiation 24/7 has also surged through the use of 5G masts, a surge due to pollution, micro plastics, 40,000 Satellites, herbicides, pesticides, and Water full of added chlorine, endocrine mimicry Micro plastics, and contamination from waste drugs, not least now confirmed Cloud seeding and the use of weather control-supposed anthropological climate change chemtrail highly toxic “dust”.
All of which in the last 20 years as multiple Mass poisoning events; Vaccines, food, Water, Air, and significant world irradiation from EMF.
Oncologist use correlation, but use the Bradford Hill viewpoints to turn correlation into causation.
Swedish Oncologists raised the level from speculation, correlation, and association to causal using those Bradford Hill viewpoints with Mobile phoned genesis initiation to cause a doubling of Glioblastoma Multiforme brain tumours C71.1 C71.2
That is a request to the WHO to accept the evidence that mobile phones EMF irradiation is a lethal carcinogen Level1.
It takes a few years-hours use each day from exposure to symptoms.
Heavy users to then get brain tumours that have doubled in 20 years since the 90%-100% homeownership of Mobile phones.
As with smoking, or asbestos the difficulty is to evidence and links cause with symptoms.
Their research has shown a doubling of cancer registration risk over twenty years.
http://downloads.hindawi.com/journals/bmri/2017/9218486.pdf
I suspect most other increasing cancer registration are also linked to pollution; food, water, air, and EMF irradiation, apart from genetic disorders and supposed “viruses”.
Even 50hz EMF radiation can activate an Epstein Barr virus to disrupt DNA.
A World shut down on the basis of flu like lethality of Covid whatever disease was, yet 599,691 US deaths in 2019 from Cancers as supposedly acceptable.
The deaths are decreasing but the registrations are multiple increasing depending on which are the "worst" increasing cancers.
https://www.cdc.gov/cancer/dcpc/research/update-on-cancer-deaths/index.htm
"There are more than 166,000 cancer deaths in the UK every year, that's more than 450 every day (2016-2018)".
https://www.cancerresearchuk.org/health-professional/cancer-statistics-for-the-uk#heading-One
Mortality rates have decreased as Cancer mitigation and technology improved, but the registrations continue to be multiple increase depending on which Cancers.
My three UK Cancer registration charts from 1998-2017
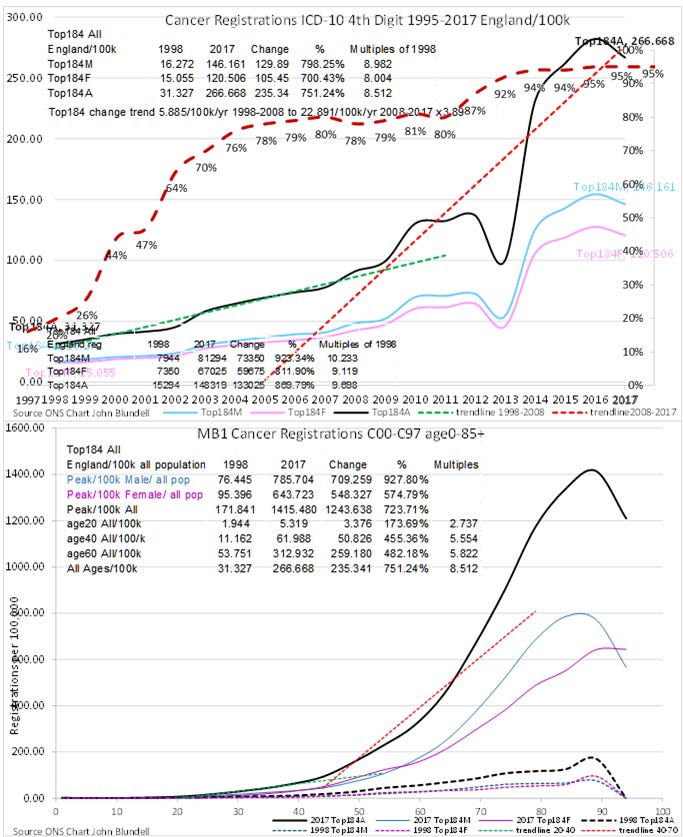
Chart1. The Top 184 worst Cancers have increased 8.5 times, 751% more since 1998.
Top chart; The black line is England All Cancer registrations, with male as blue, and female as pink.
The dashed red line it the percentage Mobile Phone ownership
The most significant issue is the surge trend (red dotted line) since 2013, in lag correlation to Mobile Phone ownership.
Chart2. The Top worst 322 cancer registrations as 5.2 times, 419% more in 20 years.
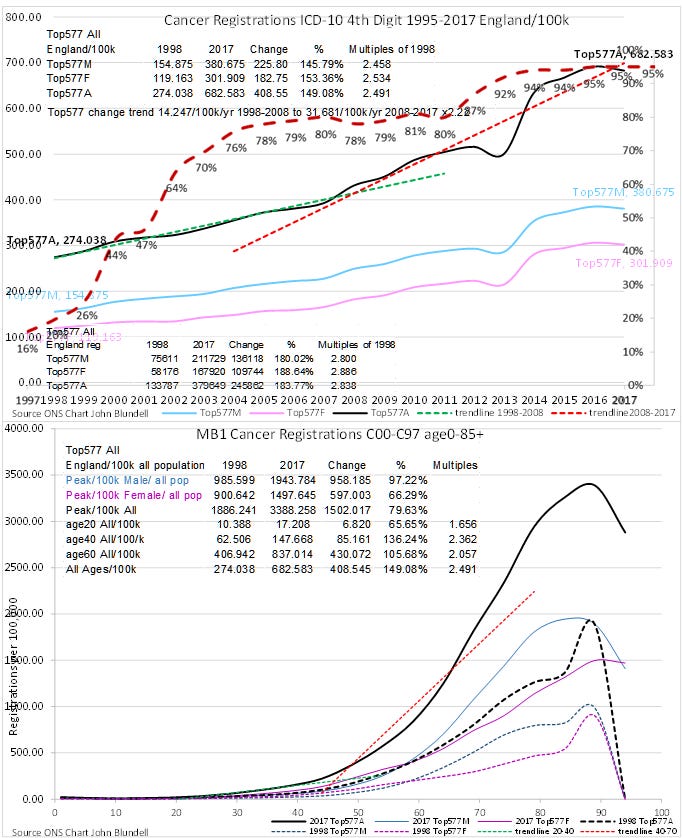
Chart3. The Top 577 Cancers as 2.5 times increase as 149% more in 20 years.
Technology and mitigation has reduced the deaths, but the registrations continue an exponential rise.
What is causing that large significant increase?
All UK Cancer registrations ID-10 C00-C97 have increased 1.5 times as 45.6% in any 20 year period, 1971-2017.
An exponential rise from 2004. that correlates to Mobile phone use, and increased pollution for associated cancers.
As with all statistics using all ICD-10 Cancers “dilutes” down to an increase of 1.6 times as many cancers are rare.
It is only by looking at the worst offenders is the reality evidenced.
The Top 184 worst Cancers have increased 8.5 times, 751% more since 1998
The Top worst 322 cancer registrations as 5.2 times, 419% more in 20 years.
The Top 577 Cancers as 2.5 times increase as 149% more in 20 years.
This is not England deaths but Cancer registrations as proportionally indicative of Cancer mortality.
As with all statistics there is “lies, damn lies and Statistics.”
ONS purport to be reliable however since the Excess deaths debacle and the attempt to negate excess deaths since 2020 supposed Pandemic by “reinventing” what excess deaths are, then only the actual registered deaths is categoric.
The rest as ONS statistical whitewash, spin, and avoidance of the previous ONS methodology to use a standard 2015-2019 average deaths to compare with deaths with the previous “normal” 5 year average.
Years post 2019 as totally abnormal yet still used as whitewash corrupted meaningless data.
As to what they died of has now being completely “whitewashed”.
My Chart4. All Cancer registrations 1971-2017 as 1.6 times 1998-2017 with a significant surge trend from 2007-2017
A blip in the data 2013 due to restructuring at ONS data collection centres
For most genesis initiation there is a lag 2-5 years dependent on intensity duration, and frequency of exposure, to the seriousness of the cancer registration.
U.S. CDC ICD10 C00 to C97 as All malignant cancer registrations has a similar database but only from 1999-2019.
The World shut down for Covid, yet Cancers and pollution are supposedly not a problem.


