

ONS just made excess deaths disappear.
ONS just made excess deaths disappear.

ONS just made excess deaths disappear.
A complaint to Sir Robert Cote Chair of the Independent statutory Office for Statistics Regulation that their experimental Statistics on excess deaths is flawed and inappropriate misrepresentation of National Statistics and not fit for purpose.
I ask Sir Robert Cote and ONS Statistics Regulation team to consider removing the ONS experimental Excess All Causes of Death methodology as invalid National statistics, as an obviously unbelievable not fit for purpose methodology to use as a 5 year average replacement, and unrealistic misalignment with previous data, and as unreliable for National Statistics.
For Statistics to be valid it has to be believed, not some esoteric number crunching that bears no resemblance to reality.
As with a previous issue in International Migration National Statistics, I ask that ONS regulators consider the withdrawal of this 5 year excess All Causes of Death methodology as not fit for purpose.
Required email complaint evidence to complaints.manager@statistics.gov.uk or regulation@statistics.gov.uk
Dear Sir Robert Cote and ONS Statistics Regulation team,
I set out the issue of excess deaths from 2020-2024, then to consider the inappropriate use of an ONS experimental methodology for calculating excess deaths that have significantly reduced or have even been made to disappear!
My analysis of the Covid Antics since 2020 and a perspective of ONS Statistics up to the inappropriate use of Experimental Statistics for Excess deaths proposed Feb2024.
My Chart1 ONS All Causes of Death 2020 as 72,916 excess deaths above a previous 5 year average
(blue line) against a 5 year average 2015-2019 (dashed black line) and possible reasons including Midazolam.
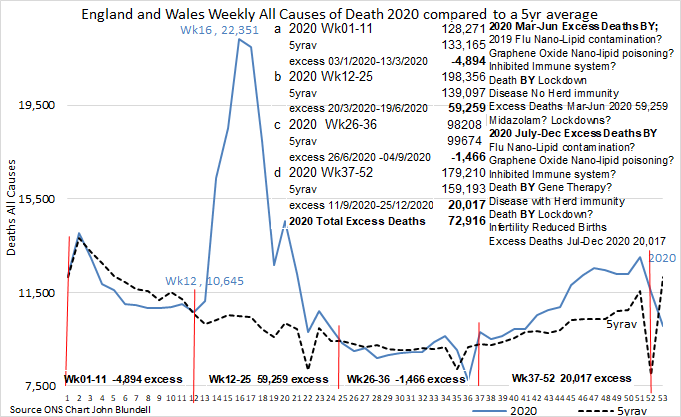
The Midazolam issue needs to be raised in the UK Parliament as a necessary debate, and to address the excessive use of Midazolam that in part may explain 72,916 excess deaths in England and Wales 2020 compared to a 2015-2019 5 year average.
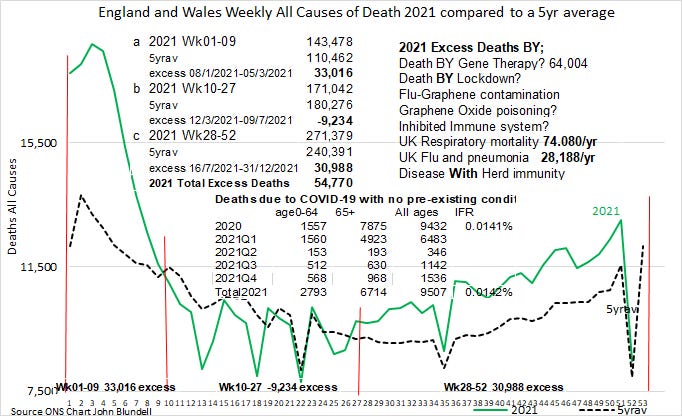
My Chart2 ONS All Causes of Death 2021 as 54,770 excess deaths above a previous 2015-2019 5 year average.
(green line) against a 5 year average 2015-2019 (dashed black line).
My Chart3 ONS All Causes of Death 2022 as 47,924 excess deaths above a previous 2015-2019 5 year average
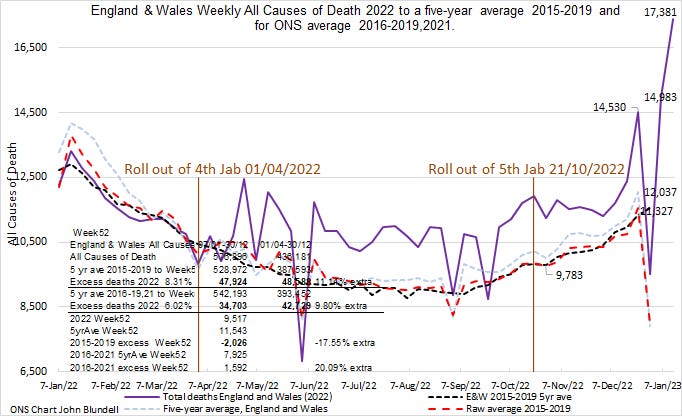
There is also a ONS March2020 revision at E&W 52,326 excess All Causes of Death.
My Chart4 ONS All Causes of Death 2023 as 50,169 excess deaths above a previous 2015-2019 5 year average

The above Charts and data was sourced on data at the end of those years and no doubt will have been subject to revisions, but ball park accurate.
The issue is what can be used as a replacement for a 5 year average that increasingly is becoming out-of-date from a 2015-2019 5 year average for 2021-2024.
Not least Euromomo is currently totally flawed as they include the same abnormal years as supposedly normal.
I suggest the ONS Experimental All Causes of Deaths average proposal Feb2024 is not fit for purpose as too esoteric for Public use, not believable, not valid, or fair representation of that data.
At best experimental, at worst misrepresentation of Statistics if ever used.
The UK Parliamentary need to debate the mRNA roll out significant correlation to 54,770 excess deaths 2021, against a ONS revised 2015-2019 5year average
There was a “spike” of 33,016 unexplained excess deaths at the same time as the mRNA roll out Jan 2021.
There are multiple explanations aswell as other toxins; Plastics hormone mimicry endocrine disruptors as multiple health issues and cancers, and especially similar correlation to EMF 5G roll out of masts in 2021. Ongoing as are excess deaths.
All of which requires our Westminster MPs, all parties to debate as fully informed of the real statistics, preferably to not have ONS make it all disappear!
Confirmation that the ONS Excess deaths are not aligned to reality.
As further corroborative independent evidence Personal Independence Payments have had significant increase in disability claims at the same time as mRNA roll out.
PIP claiming rules explained as applications reach the highest record ever - take action Jun2021
https://www.express.co.uk/finance/personalfinance/1450048/pip-claim-levels-highest-amount-full-payments
Also corroborated by the Institute for Fiscal Studies.
The number of new disability benefit claimants has doubled in a year
https://ifs.org.uk/publications/number-new-disability-benefit-claimants-has-doubled-year
My combined double Chart of DWP PIP clearances July023 compared to Cumulative mRNA Jab showing significant alignment and correlation between the two.
My Chart5 of Personal Independence Payments PIP correlation to mRNA roll out Jan2021.
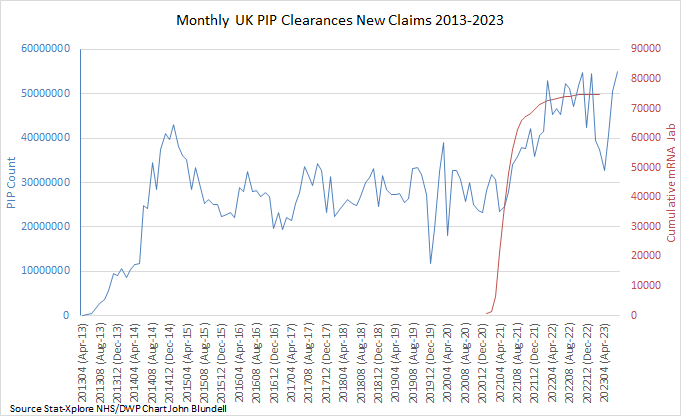
Source PIP data; https://stat-xplore.dwp.gov.uk/webapi/jsf/login.xhtml
mRNA Jab data; https://www.gov.uk/government/statistics/personal-independence-payment-statistics-to-january-2023/personal-independence-payment-statistics-april-2013-to-january-2023
A ONS Statistical methodology that does not confirm the realty in a continuous rise in PIP from 2020 to date that aswell as the Death spikes in my 4 charts by as excess deaths to any believable norm, yet an ONS Methodology on excess deaths that has supposedly disappeared.
So should the PIPclaims be disapperaed aswell?
Probably as UK Mass poisoning events that continue as 50,000+ excess deaths each year 2020-2023, yet few UK MPs prepared to debate the issues?
My proposed excess data variants are already with UK ONS and their reply that the 5 year averages are under review resulting in a Feb2024 nonsense methodology.
My data uses the latest UK ONS website revisions for each year 2010-2023; (released 17 January 2024).
ONS All Causes of Death Summary 2020-2023 of above charts made at the time.i.e. no revisions and all excess deaths using a 2015-2019 5 year average.
Disregarding population change and using data available at the end of each year against a current revision of a 2015-2019 5 year average
Year 2020 was 604,045 deaths as 72,916 13.73% excess to a 531,129 deaths current 2015-2019 average.
Year 2021 was 585,899 deaths as 54,770 10.31% excess to a 531,129 deaths current 2015-2019 average.
Year 2022 was 576,896 deaths as 45,767 8.62% excess to a 531,129 deaths current 2015-2019 average.
Year 2023 was 581,298 deaths as 50,169 9.45% excess to a 531,129 deaths current 2015-2019 average.
Data obtained at the end of each year, however with ONS revisions there will be slight differences.
It is the methodology for the experimental excess average that is disputed not the raw numbers.
https://www.ons.gov.uk/peoplepopulationandcommunity/birthsdeathsandmarriages/deaths/datasets/weeklyprovisionalfiguresondeathsregisteredinenglandandwales
Ballpark excess deaths using a 2015-2019 average as 50,000+ excess All Causes of Death 2021-2023
Although current 2015-2019 5 year average is inappropriate as it becomes out-of-date, it sets a baseline comparison against any revised methodology for a “believable” norm.
Using population increase does accurately mitigate that out-of-date issue.
Using multiple logarithmic summation Standardised populations creates incomprehensible Gobbledygook for the Public.
Not least at the end of being experimental statistics, it has to bear believable alignment with current data.
The experimental methodology fails to do that as neither simple to understand, or empirically believable, as that it is what real statistics is all about.
If it fails to inform, or credible, or unbelievable, then it fails as statistics.
I have suggested to ONS various ways to mitigate the statistical misrepresentation of the UK ONS 5 year average All Causes of Death that uses abnormal years 2021,2022, by using alternative quadratic regression, aswell as % population increase addition instead.
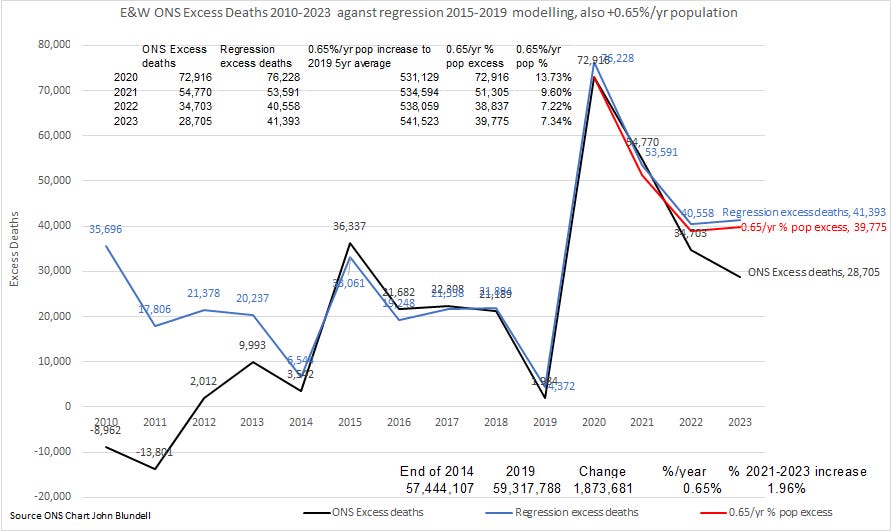
Chart 6 E&W Excess deaths using ONS All causes of death 20210-2023 against actual ONS data aswell as my two variant examples using regression aswell as %population increase added to excess deaths.
1. ONS 5 year average
2. Quadratic Regression Computer modelling 5 year averages methodology
3. 0.65%/year population increase addition to the 2015-2019 5 year average used to replace abnormal years 2021-2023 in any 5 year averages.
The outcomes of using a more simple Quadratic regression using normal years trending, or even simpler population increase/year based on the last 5 years is credib;e statistics
My Chart4 Table; A Comparison of ONS, against estimate variants Quadratic Regression, aswell as %Population increase.
ONS Excess deaths Regression excess 0.65%/yr average 0.65/yr % pop excess
2020 72,916 76,228 531,129 72,916 13.73%
2021 54,770 53,591 534,594 51,305 9.60%
2022 34,703 40,558 538,059 38,837 7.22%
2023 28,705 41,393 541,523 39,775 7.34%
Whatever 5 year average used eventually by ONS, my variant 5 year averages suggests at least 40,000+ excess death each year 2021-2023 as opposed to an ONS use of including abnormal excessive deaths from 2021, 2022 with 34,703 or 28,705 excess deaths for 2022, 2023 as underestimated applying experimental methodology after 2020.
For every abnormal year 2020-2024 to be included in that 5 year average will eventually subsumed the abnormal years into all excess deaths as supposedly “Normal”.
That is misrepresentation of National Statistics and requires the ONS Complaint dept and ONS regulators both copied in to reassess.
Even ONS methodology does not represent accurately previous data as believable with significant misalignment with a fair methodology that used a previous 5 year average.
Subsequent to the above ONS are now using an experimental Statistics that makes the excess deaths disappear and makes all ONS excess data published as a nonsense.
We have either been misled 2011-2019, or being misled 2020-2024.such is the anomaly between two methodogies that purport to be a true average to compare what are excess deaths in England and Wales.
Table 1: Annual number of excess deaths estimated by the current and new methodologies, UK, 2011 to 2019
2011 17,346 -8,827
2012 3,444 10,020
2013 12,011 22,206
2014 6,542 1,587
2015 36,836 30,858
2016 23,036 941
2017 24,000 2,925
2018 25,224 522
2019 6,006 34,408
https://www.ons.gov.uk/peoplepopulationandcommunity/healthandsocialcare/causesofdeath/articles/estimatingexcessdeathsintheukmethodologychanges/latest
Really? Is that believable statistics. So what of the previous publications 2011-2019? Make-believe?
That ONS experimental statistics causes excess death to disappear using an Eight hybrid summation esoteric number crunching. I am sure calculation for landing on the moon were simpler!
Not least so esoteric as not comprehensible to the nation who need clearly understood and meaningful statistics. Not esoteric PhD logarithmic standardised regression modelling statistical mumbo-jumbo.
A Standardised population Summation Regression methodology that in effect subsumes excess deaths as normal after 2019s simply not believable.
A new ONS normal where 40,000+ excess deaths disappear? Or is that Statistical Wokery at play?
An experimental statistical methodology which is as flawed as the 5 year average that uses abnormal years 2020-2023 that it is meant to replace!
The existing methodology for excess All Causes of Death as a previous 5years average inappropriately uses abnormal years 2020,2021,2022,2023.
That subsumes the excess as a normal average in any average using years 2020-2024 to make it disappear!
In effect a coverup of real statistics, and is actually statistical misrepresentation by convoluted logarithmic summation and standardisation.
Sorry. It may be clever stuff but it is not believable?
I propose that the experimental 8 summation regression is junked as unfit for National Statistics, and replaced by preferably a simplified average based on population increase and a 5 year average that omits identified anomalous outliers. e.g. Population increase added%, or Quadratic Regression using any recent sample years that do not have identifiable abnormality. i.e. Covid, mRNAJab or deaths or even years where the yearly Flu generated abnormal excessive data. 2015?
ONS Chart on how to make excess deaths disappear.Excess Mortality in England
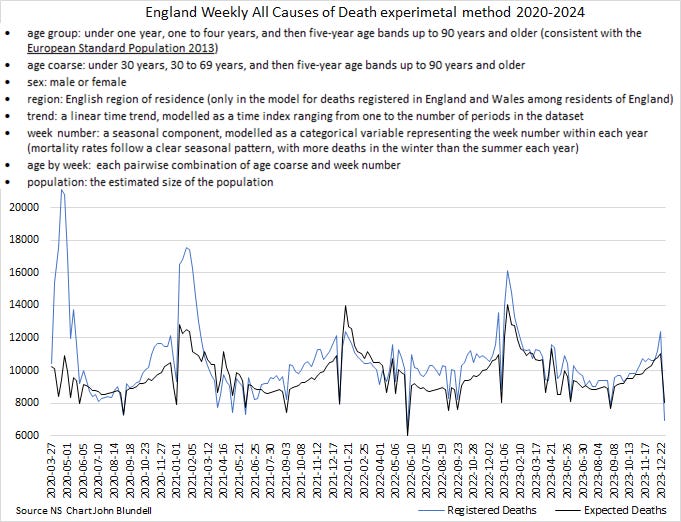
datadownload tab in https://app.powerbi.com/view?r=eyJrIjoiYmUwNmFhMjYtNGZhYS00NDk2LWFlMTAtOTg0OGNhNmFiNGM0IiwidCI6ImVlNGUxNDk5LTRhMzUtNGIyZS1hZDQ3LTVmM2NmOWRlODY2NiIsImMiOjh9
Clearly any modelling needs to be at least ball park accurate to previous as either previous data was junk or this current sta-trickstics is definitely junk.
Really? Is this the formula for a fusion reaction? Surely not an algorithm to work out who has “normally” died?
Subsequent to the above ONS are now using an experimental Statistics that makes the excess deaths disappear.
Table 1: Annual number of excess deaths estimated by the current and new methodologies, UK, 2011 to 2019
2011 -17,346 -8,827
2012 3,444 10,020
2013 12,011 22,206
2014 6,542 1,587
2015 36,836 30,858
2016 23,036 941
2017 24,000 2,925
2018 25,224 522
2019 6,006 -34,408
ONS just made excess deaths disappear.
Estimating excess deaths in the UK, methodology changes: February 2024
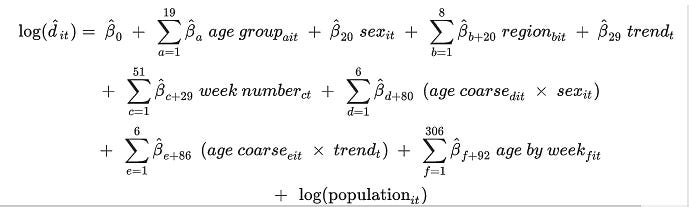
The experimental model includes:
age group: under one year, one to four years, and then five-year age bands up to 90 years and older (consistent with the European Standard Population 2013)
age coarse: under 30 years, 30 to 69 years, and then five-year age bands up to 90 years and older
sex: male or female
region: English region of residence (only in the model for deaths registered in England and Wales among residents of England)
trend: a linear time trend, modelled as a time index ranging from one to the number of periods in the dataset
week number: a seasonal component, modelled as a categorical variable representing the week number within each year (mortality rates follow a clear seasonal pattern, with more deaths in the winter than the summer each year)
age by week: each pairwise combination of age coarse and week number
population: the estimated size of the population
On an annual basis, the new method estimates negative 34,408 excess deaths (that is, fewer deaths registered than would be expected) in the UK throughout the whole of 2019 compared with 6,006 for the current method, a difference of negative 40,415 excess deaths (Table 1). This is coherent with the age-standardised mortality rate for the UK population, which fell by 3.9% between 2018 and 2019, the largest annual fall since 2009 (5.3%).
https://www.ons.gov.uk/peoplepopulationandcommunity/healthandsocialcare/causesofdeath/articles/estimatingexcessdeathsintheukmethodologychanges/february2024
Yes, a comparison of averages before, and after, as truly incongruous misaligned data of significant incredibility as of dubious believability.
Statistics is supposed to inform policy decision making and not be misleading contrived gobbledygook. Sta-trickstics!
For statistics to inform it has to be first understood. Standardised population Summations rates are inappropriate if not useless, or data that is completyy misaligne with previous making it nonsense unbelievable statistics.
Phd level statistical gobbledygook althoygh impressive, I suggest is not informative to anyone, not least as disinformation, and misleading.
Not that anyone is interested in standardised logarithmic regression modelling but a three year course in a University followed by 30 years at ONS may help!
What's the formula to solve summation of logarithms?
https://math.stackexchange.com/questions/589027/whats-the-formula-to-solve-summation-of-logarithms
In effect a very tedious repeated exercise to generate tons of esoteric uninformative junk.
My Programmable calculator does it in about 1 second, but it does not inform me of anything useful!
Same issue with Euromomo methodology that included abnormal years 2021-2023.
With Standard Deviation Z scores well below reality, when that should be around Z score 5 (red dashed line) from 2021-2023, but they used the abnormal years outliers
They did exclude data for H1N1 afetr 2009 https://www.euromomo.eu/how-it-works/methods/5 year average Excess deaths then subsumes abnormal excess deaths as an average as misrepresentation of statistics.

Regards
John Blundell